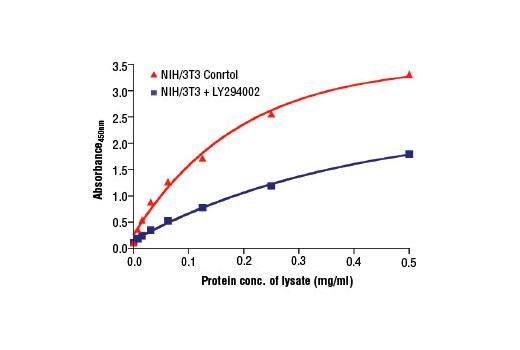
Figure 2. The relationship between the protein concentration of lysates from control NIH/3T3 cells or LY294002-treated NIH/3T3 cells and the absorbance at 450 nm is shown. NIH/3T3 cells (60-70% confluent) were treated with LY294002 #9901 (16 μM, 48 hr) and then lysed.
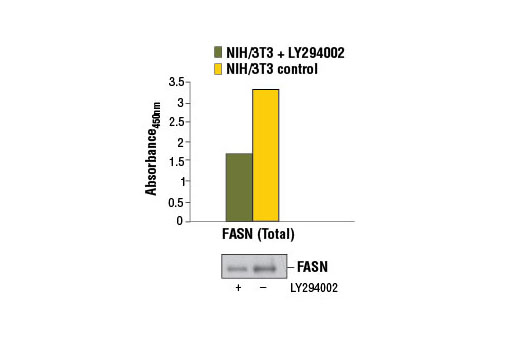
Figure 1. Treatment of NIH/3T3 cells with LY294002 decreases expression of FASN as detected by the PathScan ® Total Fatty Acid Synthase Sandwich ELISA Kit #7689. NIH/3T3 cells (60-70% confluent) were treated with LY294002 #9901 (16 μM, 48 hr). The absorbance readings at 450 nm are shown in the top figure, while the corresponding western blot using Fatty Acid Synthase (C20G5) Rabbit mAb #3180 is shown in the bottom figure.