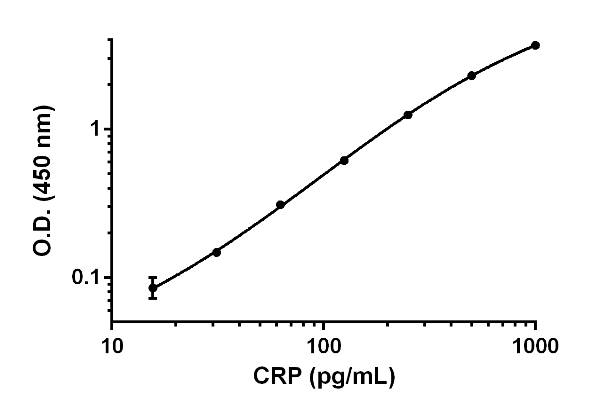
Background-subtracted data values (mean +/- SD, n=2) are graphed.
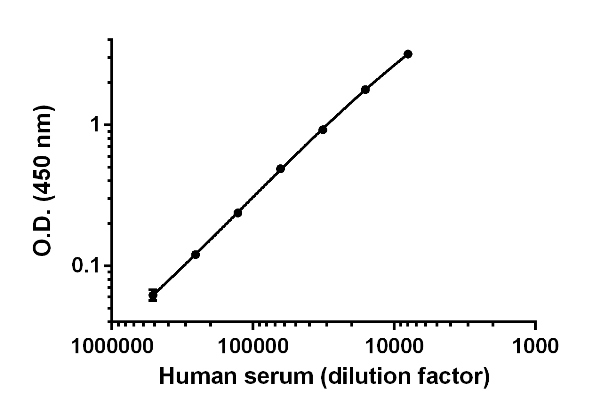
Background subtracted data values (mean +/- SD, n=2) are graphed.
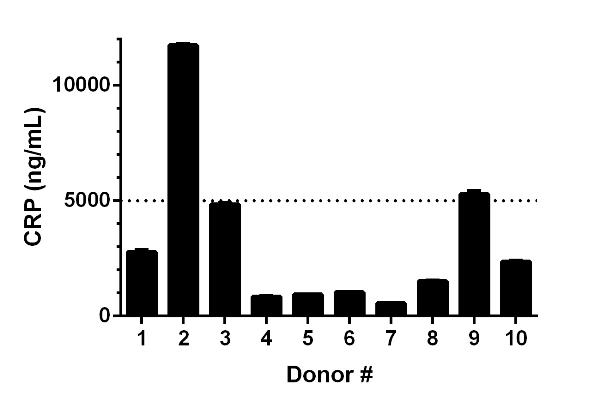
10,000X diluted sera from 10 apparently healthy male donors were measured using this kit. Interpolated data values corrected for sample dilution are graphed in ng of CRP per mL of serum (mean +/- SD, n=2). Nine out of ten individual Human sera tested within or at reported Human serum range (< 5,000 ng/mL, dotted line). The mean of CRP concentration of these nine individual sera was determined to be 2,240 ng/mL with a range of 559 – 5,285 ng/mL. Note that one individual Human serum sample (donor # 2) tested substantially higher, 11,737 ng/mL.
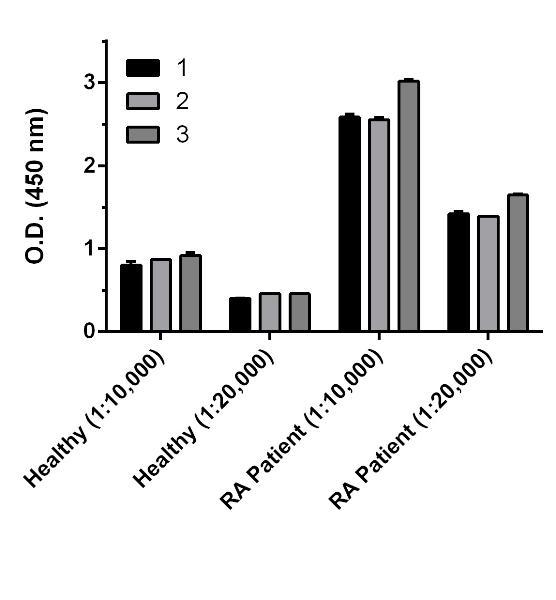
Background subtracted data values of two serum dilutions (as indicated in parenthesis) are graphed (mean +/- SD, n=2).
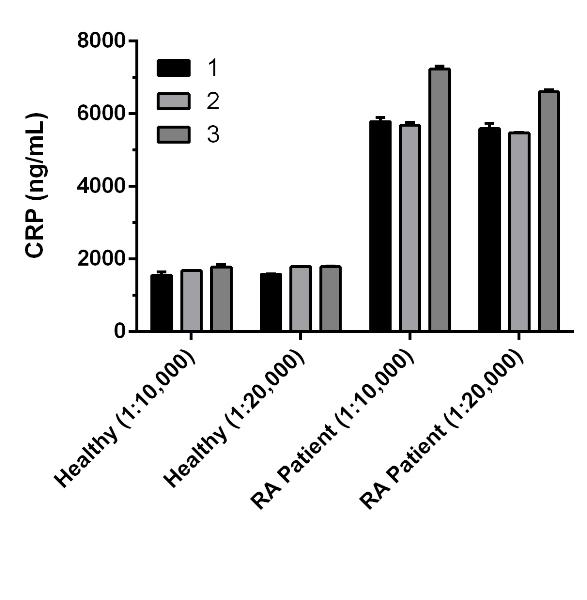
The concentrations of CRP were interpolated from data values shown above using the CRP standard curve, corrected for sample dilution, and graphed in ng of CRP per mL of serum. As expected, note that the CRP serum concentrations are increased in RA patients.


