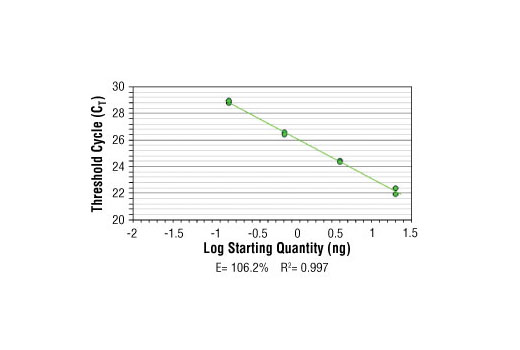
SimpleChIP ® Human H19/Igf2 Imprinting Control Region Primers were tested on DNA isolated from cross-linked cells using the SimpleChIP ® Enzymatic Chromatin IP Kit (Magnetic Beads) #9003. Real-time PCR was performed in duplicate on a serial dilution of 2% total input DNA (20 ng, 4 ng, 0.8 ng, and 0.16 ng) using a real-time PCR detection system and SYBR ® Green reaction mix. The PCR amplification efficiency (E) and correlation coefficient (R 2 ) were calculated based on the corresponding threshold cycle (C T ) of each dilution sample during 40 cycles of real-time PCR (95°C denaturation for 15 sec, 60°C anneal/extension for 60 sec).
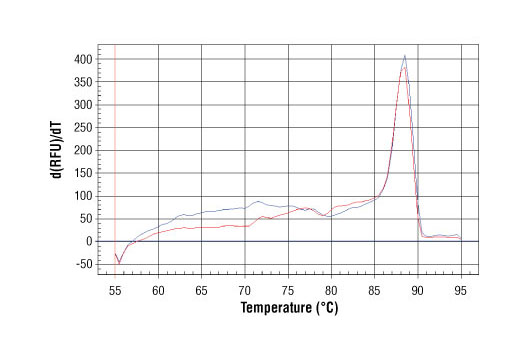
PCR product melting curves were obtained for real-time PCR reactions performed using SimpleChIP ® Human H19/Igf2 Imprinting Control Region Primers. Data is shown for both duplicate PCR reactions using 20 ng of total DNA. The melt curve consists of 80 melt cycles, starting at 55°C with increments of 0.5°C per cycle. Each peak is formed from the degradation of a single PCR product.