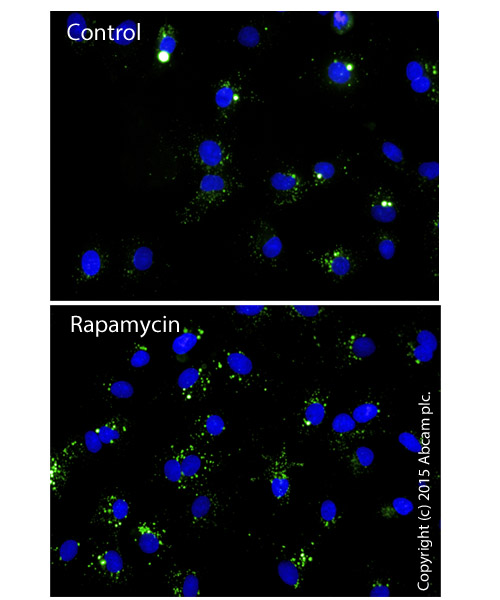
Fluorescent microscopy analysis showing nucleus (blue nuclear stain; DAPI filter) and autophagic vesicules (green, FITC filter) in control HepG2 cells or cells treated with 1 uM Rapamycin (ab120224) for 24 hours.
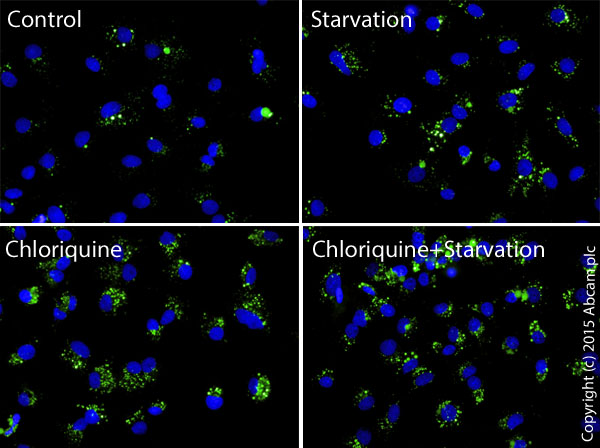
Fluorescent microscopy analysis showing nucleus (blue nuclear stain; DAPI filter) and autophagic vesicules (green, FITC filter) in control HepG2 cells or cells starved in serum free medium for 5 hours, treated with 0.1 mM chloriquine for 24 hours or starved and chloriquine treated for 5 hours.
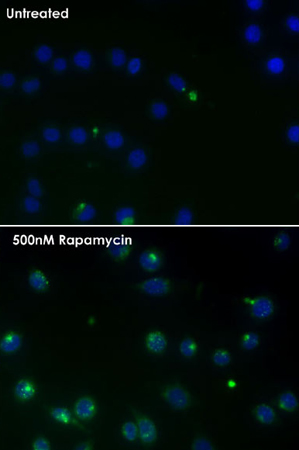
Green Detection Reagent typically accumulates in spherical vacuoles in the perinuclear region of the cells, in foci distributed throughout the cytoplasm, or in both locations, depending upon the cell type under investigation. HeLa cells were treated with 0.5 µM Rapamycin (a typical autophagy inducer) overnight. Untreated cells do not display green staining while rapamycin-treated cells display intense punctuate structures.
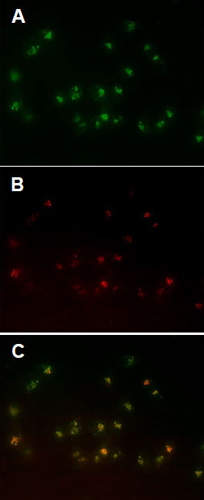
Transfected HeLa cells expressing RFP-LC3 were treated with 0.1 µM Rapamycin (a typical autophagy inducer) overnight. Panel A: Green Detection Reagent Panel B: RFP-LC3Panel C: Composite images
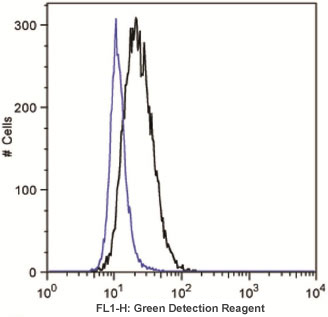
Jurkat cells (acute T-Cell leukemia), uninduced or treated overnight with 0.5 µM Rapamycin (a typical autophagy inducer) were loaded with Green Detection Reagent, then washed and analyzed by flow cytometry. Results are presented as histogram overlay. Control cells (blue solid line) were stained as well but mostly display low fluorescence. In the samples treated with 500 nM Rapamycin for 18 hours (black solid line), Green dye signal increases about 2-fold, indicating that Rapamycin induced autophagy in Jurkat cells.


