MIP1a (CCL3 ) Human SimpleStep ELISA™ Kit
| Name | MIP1a (CCL3 ) Human SimpleStep ELISA™ Kit |
|---|---|
| Supplier | Abcam |
| Catalog | ab181420 |
| Category | ELISA Kit |
| Prices | $484.00 |
| Sizes | 1 x 96 tests |
| Assay Type | Sandwich (quantitative) |
| Sample Type | Cell culture supernatant, Serum, Plasma |
| Detection | Colorimetric |
| Sensitivity | 58 pg/ml |
| Range | 0.08 ng/ml - 5 ng/ml |
| Format | Microplate |
| Applications | ELISA |
| Species Reactivities | Human |
| Gene | CCL3 |
| Supplier Page | Shop |
Product images
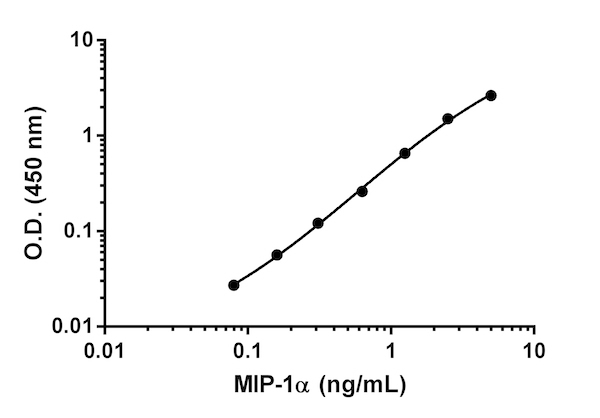 Background-subtracted data values (mean +/- SD) are graphed.
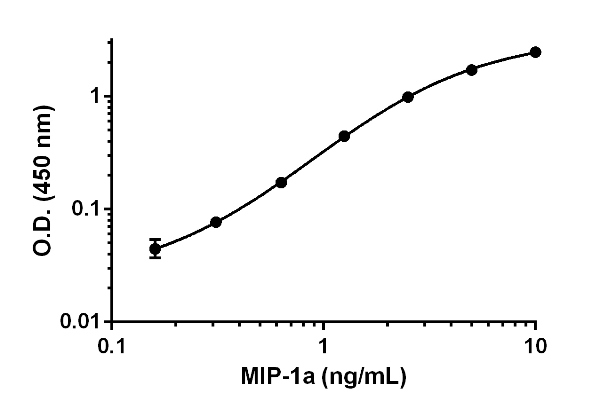 Background-subtracted data values (mean +/- SD) are graphed.
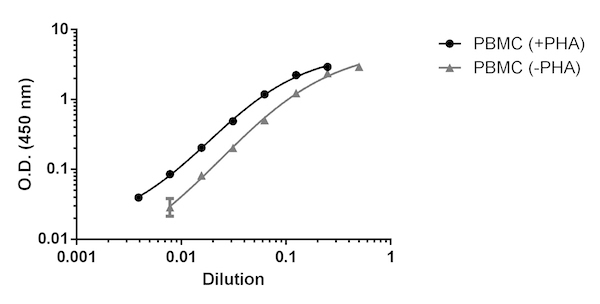 Background subtracted data from duplicate measurements are plotted.
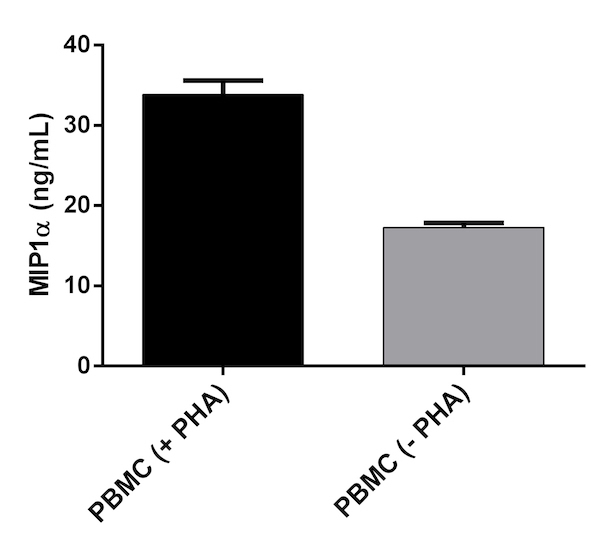 Cells were cultured unstimulated or stimulated with 10 µg/mL PHA. Conditioned media was harvested after 48 hours, aliquoted and assayed for endogenous MIP-1a levels. MIP-1a levels were interpolated from the protein standard curve and normalized for sample dilution. The mean MIP-1a levels were 33.9 ng/mL in PBMC + PHA conditioned media and 17.2 ng/mL in PBMC - PHA conditioned media.