Lactate Dehydrogenase B (LDHB) Human SimpleStep ELISA™ Kit
| Name | Lactate Dehydrogenase B (LDHB) Human SimpleStep ELISA™ Kit |
|---|---|
| Supplier | Abcam |
| Catalog | ab183367 |
| Category | ELISA Kit |
| Prices | $484.00 |
| Sizes | 1 x 96 tests |
| Assay Type | Sandwich (quantitative) |
| Sample Type | Cell culture supernatant, Serum, Tissue Extracts, Cell Lysate, Heparin Plasma, EDTA Plasma, Citrate Plasma |
| Detection | Colorimetric |
| Sensitivity | 8 pg/ml |
| Range | 0.31 ng/ml - 20 ng/ml |
| Format | Microplate |
| Applications | ELISA |
| Species Reactivities | Human |
| Gene | LDHB |
| Supplier Page | Shop |
Product images
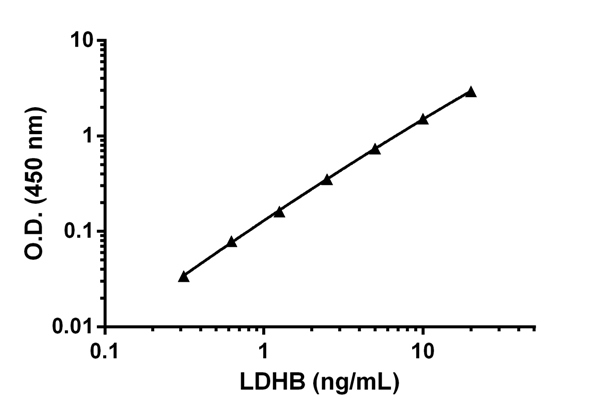 Background-subtracted data values (mean +/- SD) are graphed.
 Background-subtracted data values (mean +/- SD) are graphed.
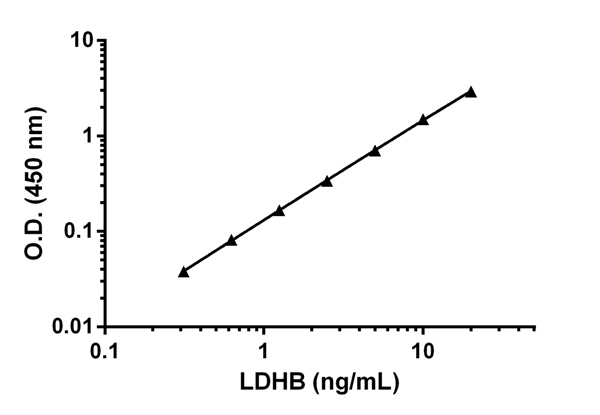
 Raw data in duplicate measurements are plotted. Background is represented as the dotted black line.
 Raw data in duplicate measurements are plotted. Background is represented as the dotted black line.
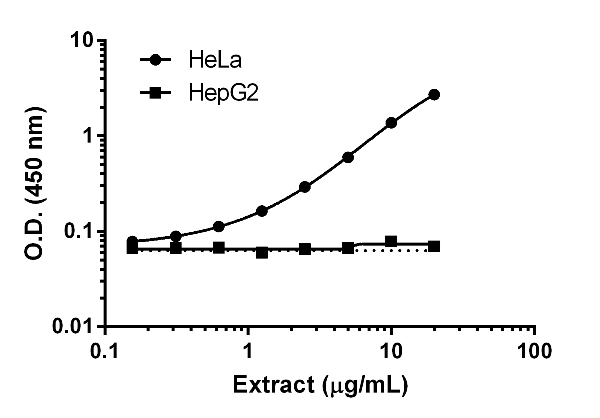
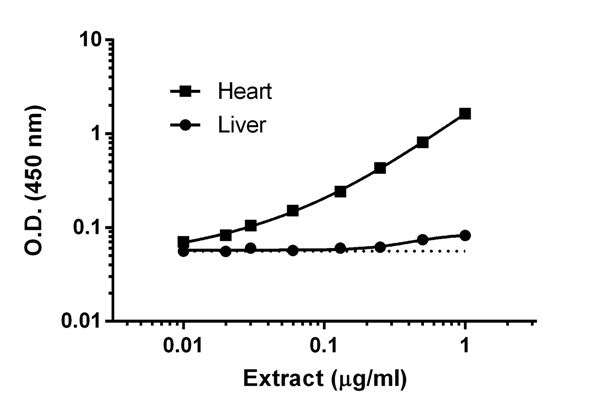
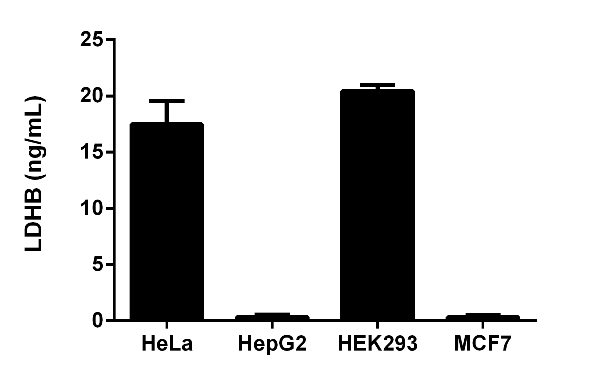 Interpolated values of LDHB are plotted for the indicated cell lines based on an extract load of 20 µg/mL.
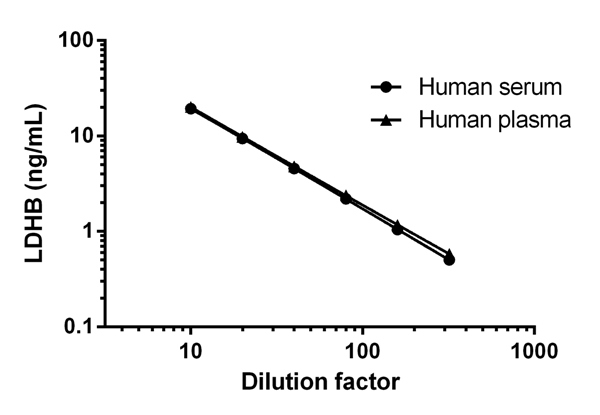 The concentrations of LDHB were interpolated from the LDHB standard curve and corrected for sample dilution. The mean LDHB concentration was determined to be 197 ng/mL in plasma (heparin) and 173 ng/mL in serum.
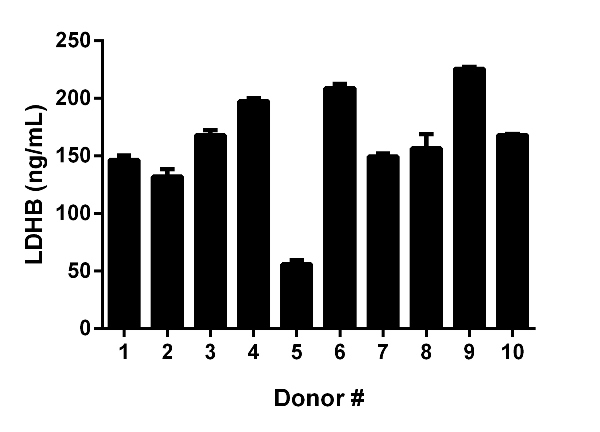 Serum from 10 apparently healthy male donors was measured in triplicate for LDHB. The mean LDHB concentration was determined to be 161 ng/mL with a range of 56 – 226 ng/mL.