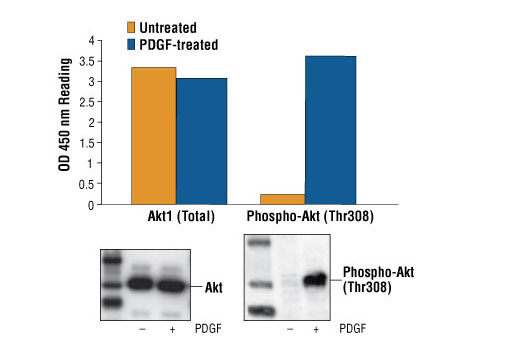
Figure 1: Treatment of NIH/3T3 cells with PDGF stimulates phosphorylation of Akt at Thr308, detected by PathScan® Phospho-Akt (Thr308) Sandwich ELISA Kit #7252, but does not affect the level of total Akt detected by PathScan® Total Akt1 Sandwich ELISA Kit #7170. OD 450 nm readings are shown in the top figure, while the corresponding Western blots using Phospho-Akt (Thr308) Antibody #9275 (right panel) or Akt Antibody #9272 (left panel), are shown in the bottom figure.
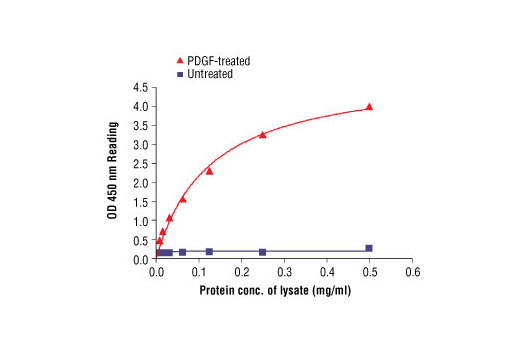
Figure 2: The relationship between protein concentration of lysates from untreated and PDGF-treated NIH/3T3 cells and kit assay optical density readings is shown. After starvation, NIH/3T3 cells (85% confluence) were treated with PDGF (50 ng/ml) for 10 min at 37°C, and then lysed.