Fibronectin Human SimpleStep ELISA™ Kit
| Name | Fibronectin Human SimpleStep ELISA™ Kit |
|---|---|
| Supplier | Abcam |
| Catalog | ab181419 |
| Category | ELISA Kit |
| Prices | $484.00 |
| Sizes | 1 x 96 tests |
| Assay Type | Sandwich (quantitative) |
| Sample Type | Cell culture supernatant, Urine, Serum, Plasma |
| Detection | Colorimetric |
| Sensitivity | 70 pg/ml |
| Range | 200 pg/ml - 12500 pg/ml |
| Format | Microplate |
| Applications | ELISA |
| Species Reactivities | Human |
| Gene | FN1 |
| Supplier Page | Shop |
Product images
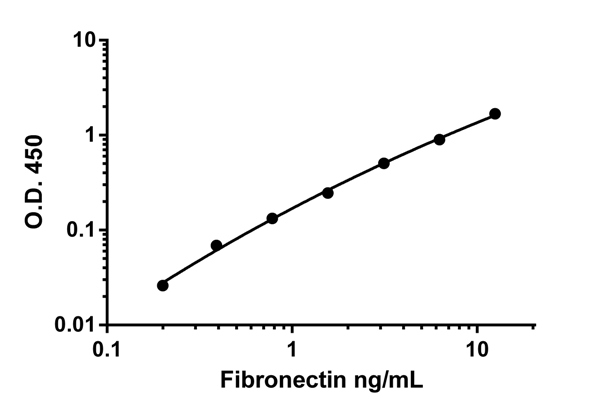 Background-subtracted data values (mean +/- SD) are graphed.
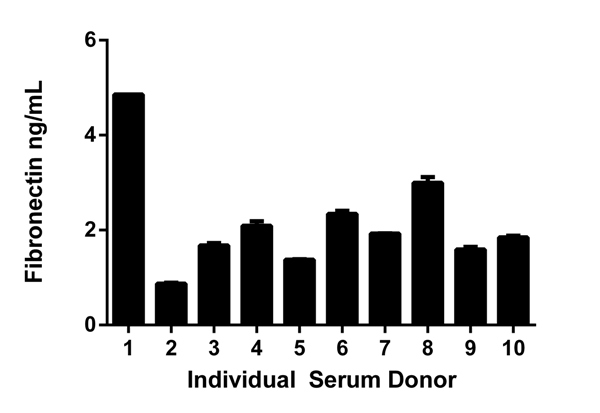
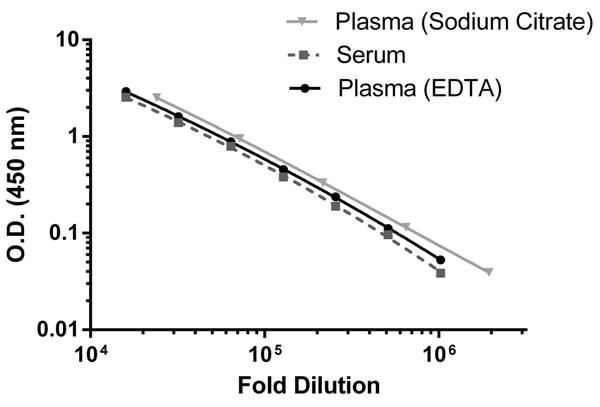 Background subtracted data from duplicate measurements are plotted.
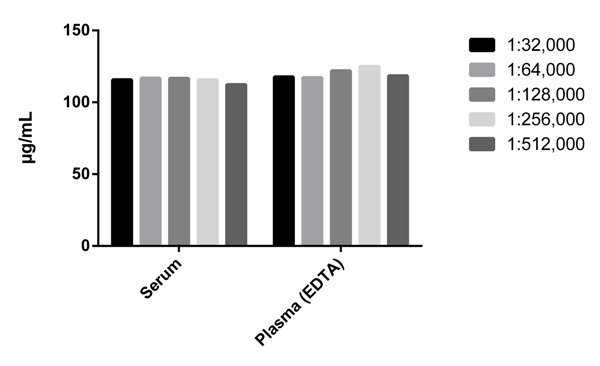 Interpolated values from three concentrations were multiplied by their dilution factor to represent the level in a neat sample. Background subtracted data is plotted
 Background subtracted data from duplicate measurements are plotted.
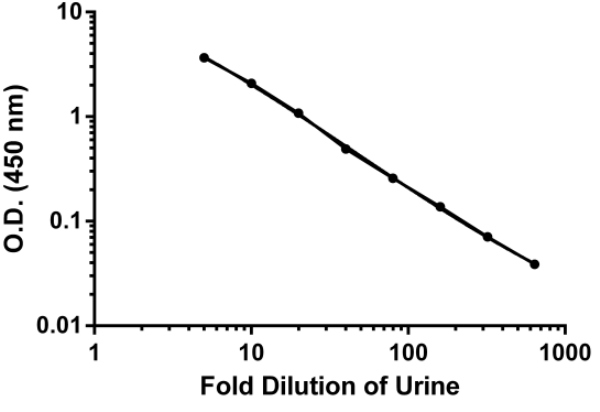
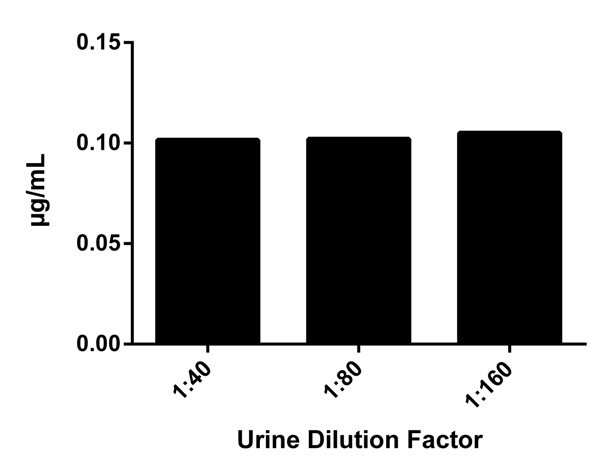 Fibronectin levels in Human urine. Interpolated values from three concentrations were multiplied by their dilution factor to represent the level in a neat sample. Background subtracted data from duplicate measurements are plotted.
 Background subtracted data from duplicate measurements are plotted.