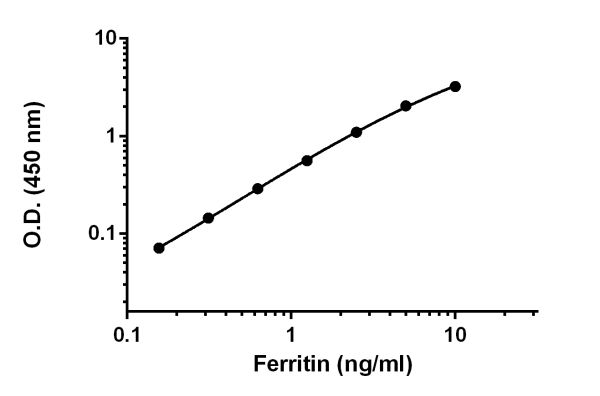
Background-subtracted data values (mean +/- SD) are graphed.
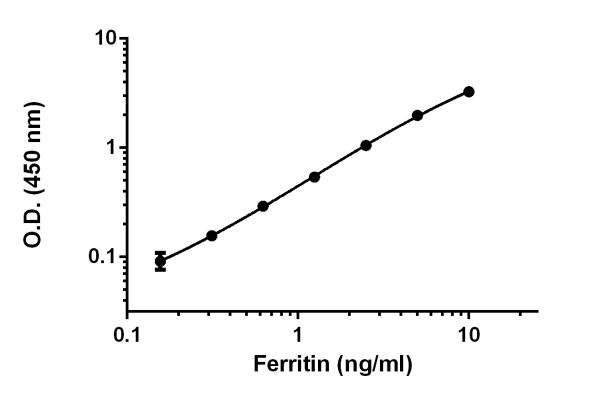
Background-subtracted data values (mean +/- SD) are graphed.
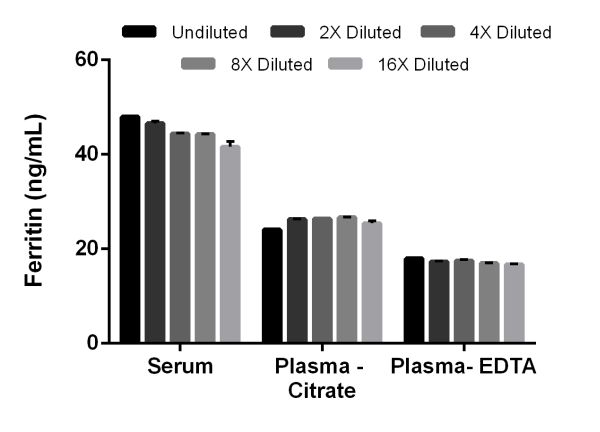
The concentrations of Ferritin were measured in duplicate and interpolated from the Ferritin standard curve and corrected for sample dilution. The interpolated dilution factor corrected values are plotted (mean +/- SD, n=2). The mean Ferritin concentration was determined to be 43.1 ng/mL in serum, 25.5 ng/mL in plasma-citrate, and 17.2 ng/mL in plasma-EDTA.
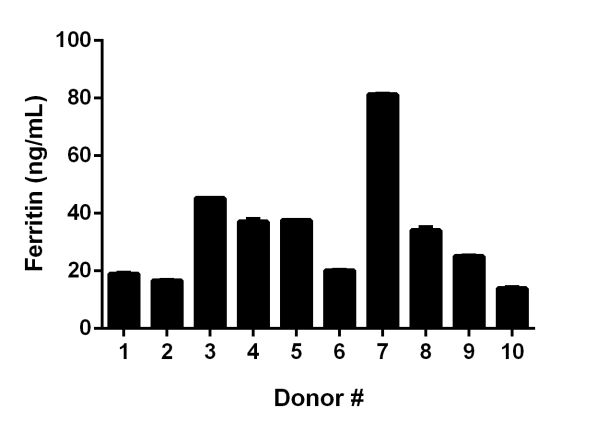
Serum from 10 apparently healthy male donors was measured in duplicate. The mean Ferritin concentration was determined to be 33.1 ng/mL with a range of 14-81 ng/mL.
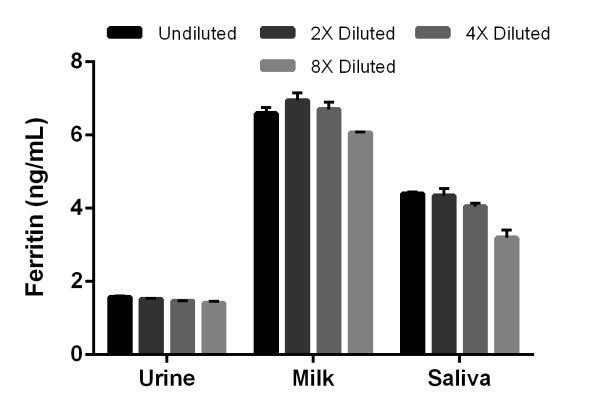
The concentrations of Ferritin were measured in duplicate and interpolated from the Ferritin standard curve and corrected for sample dilution. The interpolated dilution factor corrected values are plotted (mean +/- SD, n=2). The mean Ferritin concentration was determined to be 1.4 ng/mL in urine, 6.6 ng/mL in milk, and 4 ng/mL in saliva.