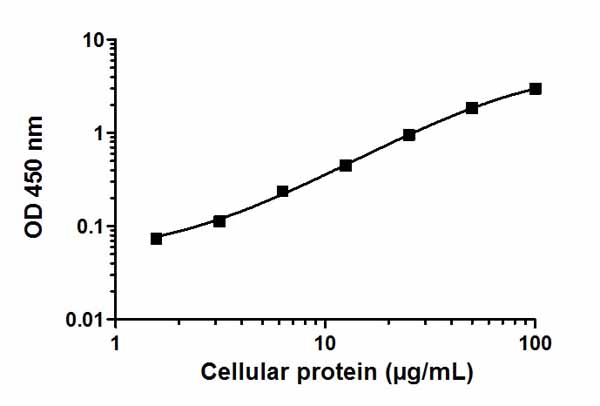
Example of a typical ERK1/2 cell lysate dilution series. Background-subtracted data values (mean +/- SD) are graphed.
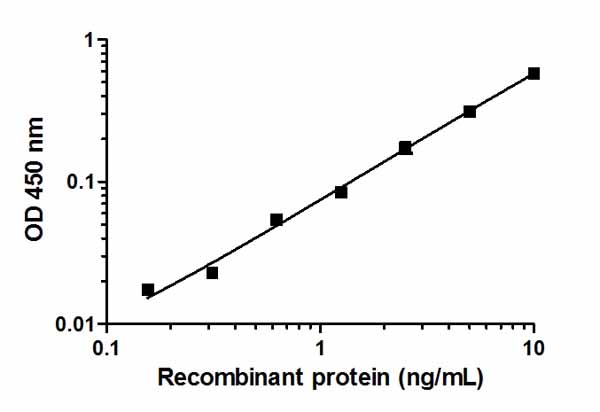
Example of a typical ERK1/2 recombinant protein standard curve. Background-subtracted data values (mean +/- SD) are graphed.
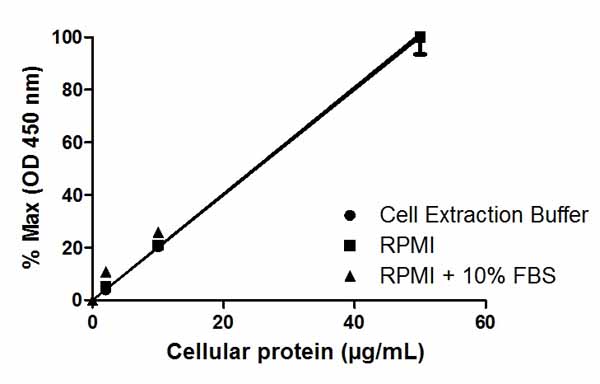
Linearity of dilution in representative sample matrices. Cellular lysates were prepared at 3 concentrations in common media containing 1X Cell Extraction Buffer PTR. Data from duplicate measurements of ERK1/2 (Total) are normalized and plotted.
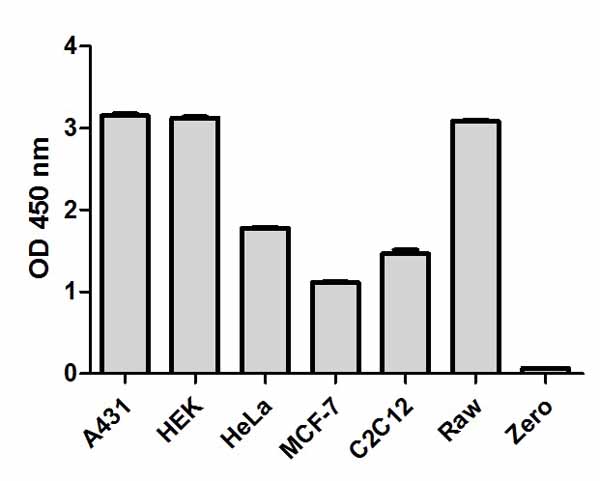
Cell line analysis for Total ERK1/2 from 100 µg/mL preparations of cell extracts. Data from triplicate measurements (mean +/- SD) are plotted and compared to 1X Cell Extraction Buffer PTR (zero).
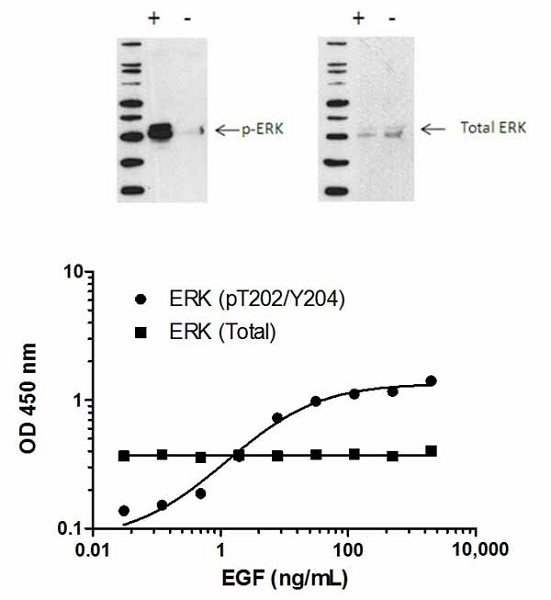
Induction of ERK1/2 (pT202/Y204) phosphorylation in MCF-7 cells in response to EGF treatment. MCF-7 cells were cultured in 96-well tissue culture plates, serum starved and treated (10 min) with a dose-range of EGF before cell lysis. Data from quadruplicate measurements of ERK1/2 (pT202/Y204) are plotted and compared against Total ERK1/2 protein levels. Comparative ERK1/2 (pT202/Y204) and ERK1/2 (Total) data also shown by Western Blot.