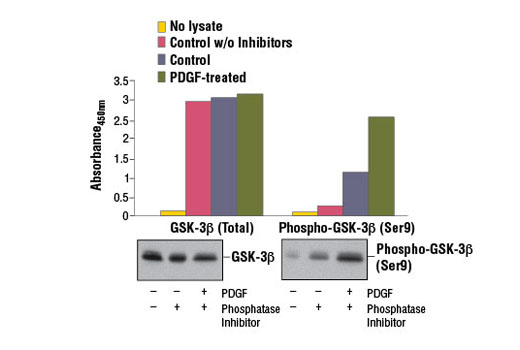
Figure 1. Treatment of NIH/3T3 cells with hPDGF-BB #8912 stimulates phosphorylation of GSK-3β at Ser9, as detected by PathScan ® Phospho-GSK-3β (Ser9) Sandwich ELISA Kit #7311, but does not affect levels of total GSK-3β protein detected by PathScan ® Total GSK-3β Sandwich ELISA Kit #7265. The absorbance readings at 450 nm are shown in the upper figure, while the corresponding western blots using GSK-3β (27C10) Rabbit mAb #9315 (left panel) or Phospho-GSK-3β (Ser9) (D85E12) XP ® Rabbit mAb #5558 (right panel) is shown in the lower figure.
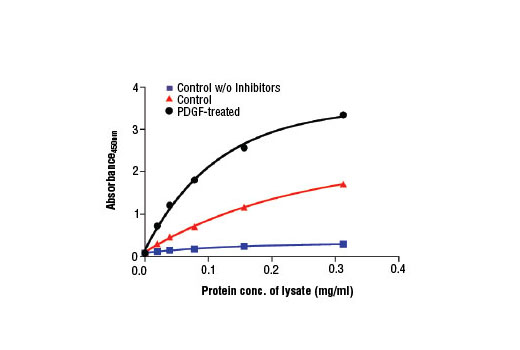
Figure 2. The relationship between protein concentration of lysates from untreated and PDGF-treated NIH/3T3 cells and the absorbance at 450 nm is shown. After starvation, NIH/3T3 cells (85% confluence) were treated with hPDGF-BB #8912 (50 ng/ml) for 10-15 minutes at 37ºC and then lysed.