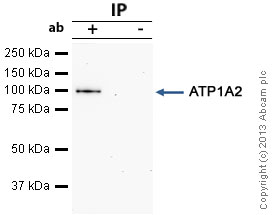
ATP1A2 was immunoprecipitated using 0.5mg Mouse Kidney tissue extract, 5µg of Mouse monoclonal to ATP1A2 and 50µl of protein G magnetic beads (+). No antibody was added to the control (-).The antibody was incubated under agitation with Protein G beads for 10min, Mouse Kidney tissue extract lysate diluted in RIPA buffer was added to each sample and incubated for a further 10min under agitation.Proteins were eluted by addition of 40µl SDS loading buffer and incubated for 10min at 70°C; 10µl of each sample was separated on a SDS PAGE gel, transferred to a nitrocellulose membrane, blocked with 5% BSA and probed with ab2871.Secondary: Goat polyclonal to mouse IgG light chain specific (HRP) at 1/20,000 dilution.Band: 102kDa; ATP1A2
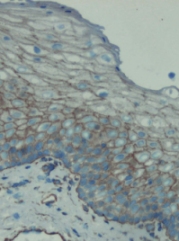
This image was kindly supplied as part of the review submitted by Marko Nykanen.
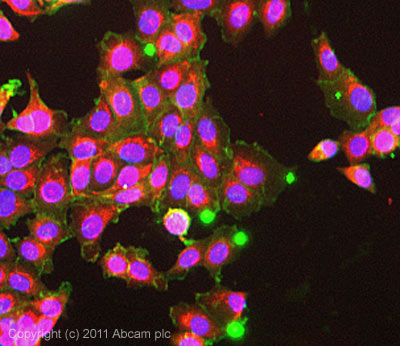
ICC/IF image of ab2871 stained MCF7 cells. The cells were 100% methanol fixed (5 min) and then incubated in 1%BSA / 10% normal goat serum / 0.3M glycine in 0.1% PBS-Tween for 1h to permeabilise the cells and block non-specific protein-protein interactions. The cells were then incubated with the antibody (ab2871, 10µg/ml) overnight at +4°C. The secondary antibody (green) was ab96879, DyLight® 488 goat anti-mouse IgG (H+L) used at a 1/250 dilution for 1h.Alexa Fluor® 594 WGA was used to label plasma membranes (red) at a 1/200 dilution for 1h. DAPI was used to stain the cell nuclei (blue) at a concentration of 1.43µM.
![All lanes : Anti-ATP1A2 antibody [M7-PB-E9] (ab2871) at 1/500 dilutionLane 1 : Kidney (Human) Tissue Lysate - adult normal tissue (ab30203)Lane 2 : Kidney (Mouse) Tissue LysateLane 3 : Kidney (Rat) Tissue LysateLysates/proteins at 20 µg per lane.SecondaryGoat Anti-Mouse IgG H&L (HRP) preadsorbed (ab97040) at 1/5000 dilutiondeveloped using the ECL techniquePerformed under reducing conditions.](http://www.bioprodhub.com/system/product_images/ab_products/2/sub_1/10994_ATP1A2-Primary-antibodies-ab2871-4.jpg)
All lanes : Anti-ATP1A2 antibody [M7-PB-E9] (ab2871) at 1/500 dilutionLane 1 : Kidney (Human) Tissue Lysate - adult normal tissue (ab30203)Lane 2 : Kidney (Mouse) Tissue LysateLane 3 : Kidney (Rat) Tissue LysateLysates/proteins at 20 µg per lane.SecondaryGoat Anti-Mouse IgG H&L (HRP) preadsorbed (ab97040) at 1/5000 dilutiondeveloped using the ECL techniquePerformed under reducing conditions.
![Overlay histogram showing HEK293 cells stained with ab2871 (red line). The cells were fixed with 80% methanol (5 min) and incubated in 1x PBS / 10% normal goat serum / 0.3M glycine to block non-specific protein-protein interactions. The cells were then incubated with the antibody (ab28711, 1/100 dilution) for 30 min at 22ºC. The secondary antibody used was DyLight® 488 goat anti-mouse IgG (H+L) (ab96879) at 1/500 dilution for 30 min at 22ºC. Isotype control antibody (black line) was mouse IgG1 [ICIGG1] (ab91353, 2µg/1x106 cells) used under the same conditions. Acquisition of >5,000 events was performed. Please note that Abcam do not have any data for use of this antibody on non-fixed cells. We welcome any customer feedback.](http://www.bioprodhub.com/system/product_images/ab_products/2/sub_1/10995_ATP1A2-Primary-antibodies-ab2871-5.jpg)
Overlay histogram showing HEK293 cells stained with ab2871 (red line). The cells were fixed with 80% methanol (5 min) and incubated in 1x PBS / 10% normal goat serum / 0.3M glycine to block non-specific protein-protein interactions. The cells were then incubated with the antibody (ab28711, 1/100 dilution) for 30 min at 22ºC. The secondary antibody used was DyLight® 488 goat anti-mouse IgG (H+L) (ab96879) at 1/500 dilution for 30 min at 22ºC. Isotype control antibody (black line) was mouse IgG1 [ICIGG1] (ab91353, 2µg/1x106 cells) used under the same conditions. Acquisition of >5,000 events was performed. Please note that Abcam do not have any data for use of this antibody on non-fixed cells. We welcome any customer feedback.
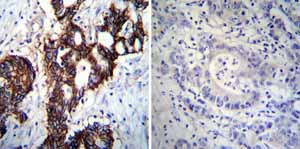
Immunohistochemistry was performed on both normal and cancer biopsies of deparaffinized Human colon carcinoma tissues. To expose target proteins heat induced antigen retrieval was performed using 10mM sodium citrate (pH6.0) buffer microwaved for 8-15 minutes. Following antigen retrieval tissues were blocked in 3% BSA-PBS for 30 minutes at room temperature. Tissues were then probed at a dilution of 1:100 with a mouse monoclonal antibody recognizing Sodium/Potassium ATPase alpha ab2871 or without primary antibody (negative control) overnight at 4°C in a humidified chamber. Tissues were washed extensively with PBST and endogenous peroxidase activity was quenched with a peroxidase suppressor. Detection was performed using a biotin-conjugated secondary antibody and SA-HRP followed by colorimetric detection using DAB. Tissues were counterstained with hematoxylin and prepped for mounting.
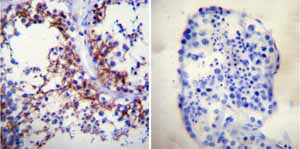
Immunohistochemistry was performed on both normal and cancer biopsies of deparaffinized Human testis tissue tissues. To expose target proteins heat induced antigen retrieval was performed using 10mM sodium citrate (pH6.0) buffer microwaved for 8-15 minutes. Following antigen retrieval tissues were blocked in 3% BSA-PBS for 30 minutes at room temperature. Tissues were then probed at a dilution of 1:200 with a mouse monoclonal antibody recognizing Sodium/Potassium ATPase alpha ab2871 or without primary antibody (negative control) overnight at 4°C in a humidified chamber. Tissues were washed extensively with PBST and endogenous peroxidase activity was quenched with a peroxidase suppressor. Detection was performed using a biotin-conjugated secondary antibody and SA-HRP followed by colorimetric detection using DAB. Tissues were counterstained with hematoxylin and prepped for mounting.
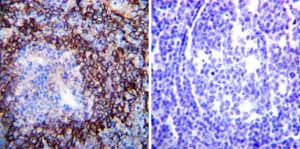
Immunohistochemistry was performed on both normal and cancer biopsies of deparaffinized Human tonsil tissue tissues. To expose target proteins heat induced antigen retrieval was performed using 10mM sodium citrate (pH6.0) buffer microwaved for 8-15 minutes. Following antigen retrieval tissues were blocked in 3% BSA-PBS for 30 minutes at room temperature. Tissues were then probed at a dilution of 1:200 with a mouse monoclonal antibody recognizing Sodium/Potassium ATPase alpha ab2871 or without primary antibody (negative control) overnight at 4°C in a humidified chamber. Tissues were washed extensively with PBST and endogenous peroxidase activity was quenched with a peroxidase suppressor. Detection was performed using a biotin-conjugated secondary antibody and SA-HRP followed by colorimetric detection using DAB. Tissues were counterstained with hematoxylin and prepped for mounting.
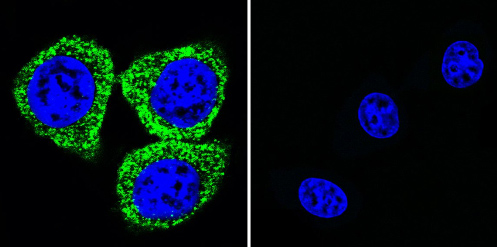
Immunocytochemistry/Immunofluorescence analysis of ATP1A2 shows staining in HeLa cells. ATP1A2 (green), F-Actin staining with Phalloidin (red) and nuclei with DAPI (blue) is shown. Cells were grown on chamber slides and fixed with formaldehyde prior to staining. Cells were incubated without (control) or with ab2871 (1:20) overnight at 4°C, washed with PBS and incubated with a DyLight-488 conjugated secondary antibody. Images were taken at 60X magnification.
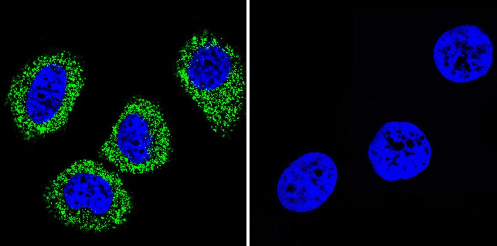
Immunocytochemistry/Immunofluorescence analysis of ATP1A2 shows staining in MCF-7 cells. ATP1A2 (green), F-Actin staining with Phalloidin (red) and nuclei with DAPI (blue) is shown. Cells were grown on chamber slides and fixed with formaldehyde prior to staining. Cells were incubated without (control) or with ab2871 (1:20) overnight at 4°C, washed with PBS and incubated with a DyLight-488 conjugated secondary antibody. Images were taken at 60X magnification.
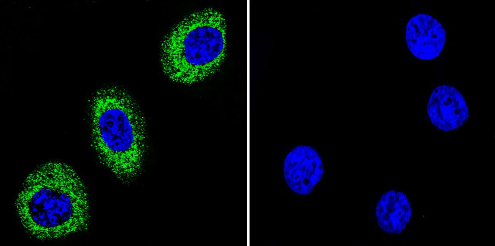
Immunocytochemistry/Immunofluorescence analysis of ATP1A2 shows staining in U251 cells. ATP1A2 (green), F-Actin staining with Phalloidin (red) and nuclei with DAPI (blue) is shown. Cells were grown on chamber slides and fixed with formaldehyde prior to staining. Cells were incubated without (control) or with ab2871 (1:20) overnight at 4°C, washed with PBS and incubated with a DyLight-488 conjugated secondary antibody. Images were taken at 60X magnification.


![All lanes : Anti-ATP1A2 antibody [M7-PB-E9] (ab2871) at 1/500 dilutionLane 1 : Kidney (Human) Tissue Lysate - adult normal tissue (ab30203)Lane 2 : Kidney (Mouse) Tissue LysateLane 3 : Kidney (Rat) Tissue LysateLysates/proteins at 20 µg per lane.SecondaryGoat Anti-Mouse IgG H&L (HRP) preadsorbed (ab97040) at 1/5000 dilutiondeveloped using the ECL techniquePerformed under reducing conditions.](http://www.bioprodhub.com/system/product_images/ab_products/2/sub_1/10994_ATP1A2-Primary-antibodies-ab2871-4.jpg)
![Overlay histogram showing HEK293 cells stained with ab2871 (red line). The cells were fixed with 80% methanol (5 min) and incubated in 1x PBS / 10% normal goat serum / 0.3M glycine to block non-specific protein-protein interactions. The cells were then incubated with the antibody (ab28711, 1/100 dilution) for 30 min at 22ºC. The secondary antibody used was DyLight® 488 goat anti-mouse IgG (H+L) (ab96879) at 1/500 dilution for 30 min at 22ºC. Isotype control antibody (black line) was mouse IgG1 [ICIGG1] (ab91353, 2µg/1x106 cells) used under the same conditions. Acquisition of >5,000 events was performed. Please note that Abcam do not have any data for use of this antibody on non-fixed cells. We welcome any customer feedback.](http://www.bioprodhub.com/system/product_images/ab_products/2/sub_1/10995_ATP1A2-Primary-antibodies-ab2871-5.jpg)


