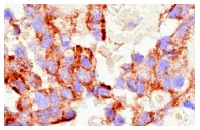
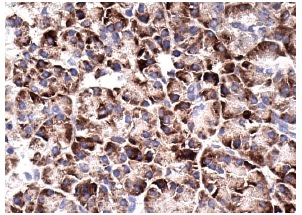
cytochrome c (A-8): sc-13156. Immunoperoxidase staining of formalin-fixed, paraffin-embedded human pancreas tumor showing cytoplasmic staining.
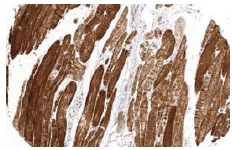
cytochrome c (A-8): sc-13156. Immunoperoxidase staining of formalin fixed, paraffin-embedded human skeletal muscle tissue showing cytoplasmic staining of myocytes. Kindly provided by The Swedish Human Protein Atlas (HPA) program.
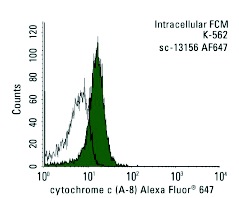
cytochrome c (A-8) Alexa Fluor 647: sc-13156 AF647. Intracellular FCM analysis of fixed and permeabilized K-562 cells. Black line histogram represents the isotype control, normal mouse IgG
2b: sc-24638.
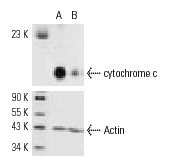
cytochrome c siRNA (m): sc-29293. Western blot analysis of cytochrome c expression in non-transfected control (A) and cytochrome c siRNA transfected (B) TK-1 cells. Blot probed with cytochrome c (A-8): sc-13156. Actin (I-19): sc-1616 used as specificity and loading control.
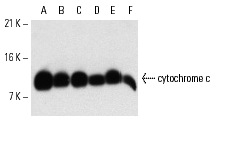
cytochrome c (A-8): sc-13156. Western blot analysis of cytochrome c expression in RAW 264.7 (A), MCP-5 (B), M1 (C), NIH/3T3 (D), WEHI-231 (E) and RAW 309 Cr.1 (F) whole cell lysates.
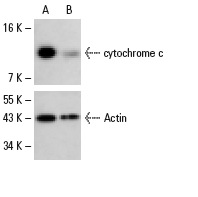
cytochrome c siRNA (h): sc-29292. Western blot analysis of cytochrome c expression in non-transfected control (A) and cytochrome c siRNA transfected (B) HeLa cells. Blot probed with cytochrome c (A-8): sc-13156. Actin (I-19): sc-1616 used as specificity and loading control.
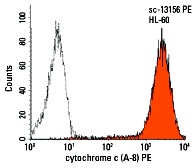
cytochrome c (A-8) PE: sc-13156 PE. Intracellular FCM analysis of fixed and permeabilized HL-60 cells. Black line histogram represents the isotype control, normal mouse IgG
2b: sc-2868.
cytochrome c (A-8): sc-13156. Western blot analysis of cytochrome c expression in RAW 264.7 (A), MCP-5 (B), M1 (C), NIH/3T3 (D), WEHI-231 (E) and RAW 309 Cr.1 (F) whole cell lysates.
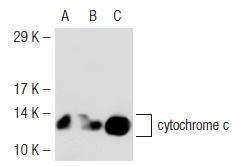
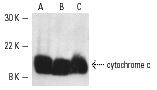
cytochrome c (A-8): sc-13156. Western blot analysis of cytochrome c expression in non-transfected 293T: sc-117752 (A), mouse cytochrome c transfected 293T: sc-119615 (B) and NIH/3T3 (C) whole cell lysates.
cytochrome c (A-8): sc-13156. Immunoperoxidase staining of formalin fixed, paraffin-embedded human pancreas tissue showing cytoplasmic staining of glandular cells.