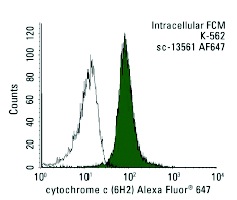
cytochrome c (6H2) Alexa Fluor 647: sc-13561 AF647. Intracellular FCM analysis of fixed and permeabilized K-562 cells. Black line histogram represents the isotype control, normal mouse IgG
1: sc-24636.
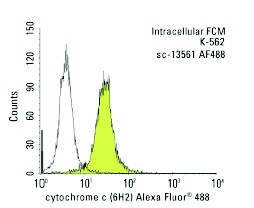
cytochrome c (6H2) Alexa Fluor 488: sc-13561 AF488. Intracellular FCM analysis of fixed and permeabilized K-562 cells. Black line histogram represents the isotype control, normal mouse IgG
1: sc-3890.
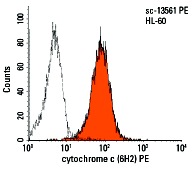
cytochrome c (6H2) PE: sc-13561 PE. Intracellular FCM analysis of fixed and permeabilized HL-60 cells. Black line histogram represents the isotype control, normal mouse IgG
1: sc-2866.
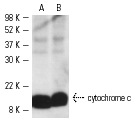
cytochrome c (6H2): sc-13561. Western blot analysis of cytochrome c expression in K-562 (A) and PC-3 (B) whole cell lysates.
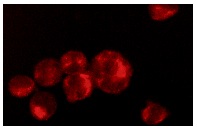
cytochrome c (6H2): sc-13561. Immunofluorescence staining of methanol-fixed K-562 cells showing cytoplasmic staining.
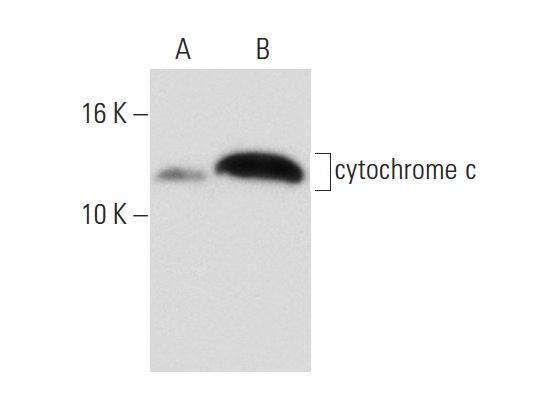
cytochrome c (6H2): sc-13561. Western blot analysis of cytochrome c expression in untreated (A) and cytochalasin D (sc-201442) treated (B) HeLa whole cell lysates.
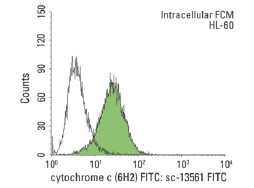
cytochrome c (6H2) FITC: sc-13561 FITC. Intracellular FCM analysis of fixed and permeabilized HL-60 cells. Black line histogram represents the isotype control, normal mouse IgG
1: sc-2855.