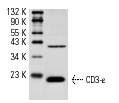
CD3-ε (UCH-T1): sc-1179. Western blot analysis of CD3-ε expression in Jurkat whole cell lysate.
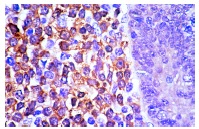
CD3-ε (UCH-T1): sc-1179. Immunoperoxidase staining of formalin-fixed, paraffin-embedded normal human tonsil showing membrane staining.
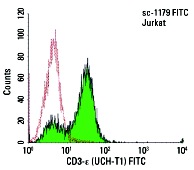
CD3-ε (UCH-T1) FITC: sc-1179 FITC. FCM analysis of Jurkat cells. Black line histogram represents the isotype control, normal mouse IgG
1: sc-2855.
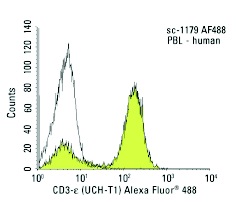
CD3-ε (UCH-T1) Alexa Fluor
® 488: sc-1179 AF488. FCM analysis of human peripheral blood leukocytes. Black line histogram represents the isotype control, normal mouse IgG
1: sc-3890.
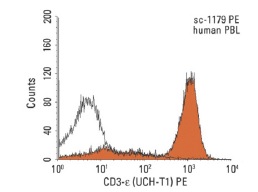
CD3-ε (UCH-T1): sc-1179. Indirect FCM analysis of human peripheral blood leukocytes stained with CD3-ε (UCH-T1), followed by PE-conjugated goat anti-mouse IgG
1: sc-3764. Black line histogram represents the isotype control, normal mouse IgG
1: sc-3877.
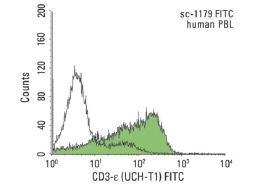
CD3-ε (UCH-T1): sc-1179. Indirect FCM analysis of human peripheral blood leukocytes stained with CD3-ε (UCH-T1), followed by FITC-conjugated goat anti-mouse IgG
1: sc-2078. Black line histogram represents the isotype control, normal mouse IgG
1: sc-3877.
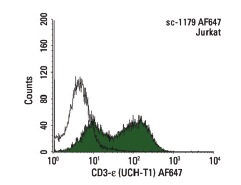
CD3-ε (UCH-T1) AF647: sc-1179 AF647. FCM analysis of Jurkat cells. Black line histogram represents the isotype control, normal mouse IgG
1: sc-24636.
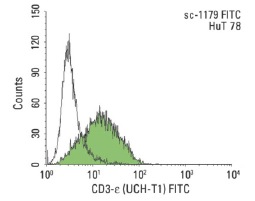
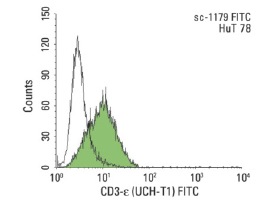
CD3-ε (UCH-T1): sc-1179. Indirect FCM analysis of HuT 78 cells stained with CD3-ε (UCH-T1), followed by FITC-conjugated chicken anti-mouse IgG: sc-2989. Black line histogram represents the isotype control, normal mouse IgG
1: sc-3877.
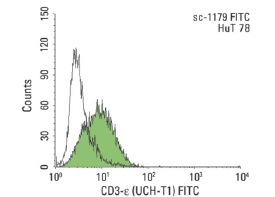
CD3-ε (UCH-T1): sc-1179. Indirect FCM analysis of HuT 78 cells stained with CD3-ε (UCH-T1), followed by FITC-conjugated bovine anti-mouse IgG: sc-2366. Black line histogram represents the isotype control, normal mouse IgG
1: sc-3877.
CD3-ε (UCH-T1): sc-1179. Indirect FCM analysis of HuT 78 cells stained with CD3-ε (UCH-T1), followed by FITC-conjugated rabbit anti-mouse IgG: sc-358916. Black line histogram represents the isotype control, normal mouse IgG
1: sc-3877.
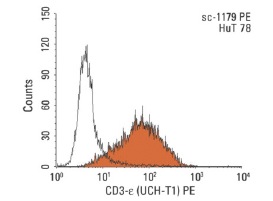
CD3-ε (UCH-T1): sc-1179. Indirect FCM analysis of HuT 78 cells stained with CD3-ε (UCH-T1), followed by PE-conjugated rabbit anti-mouse IgG: sc-358926. Black line histogram represents the isotype control, normal mouse IgG
1: sc-3877.