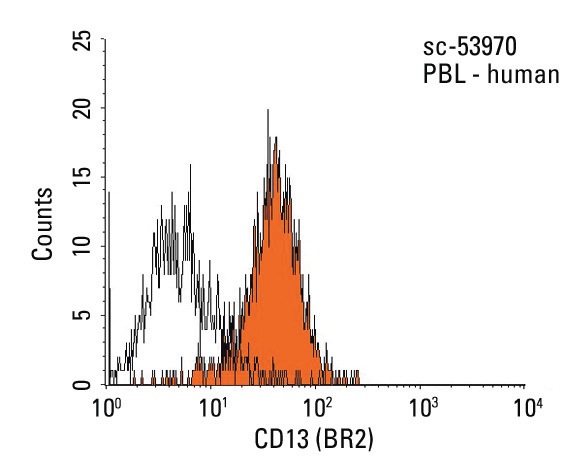
CD13 (BR2): sc-53970. Indirect FCM analysis of human peripheral blood leukocytes stained with CD13 (BR2), followed by PE-conjugated goat anti-mouse IgG: sc-3738. Black line histogram represents the isotype control, normal mouse IgG
1: sc-3877.
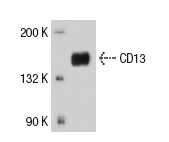
Western blot analysis of CD13 expression in GBB whole cell lysate immunoprecipitated with CD13 (BR2): sc-53970 and detected with CD13 (3D8): sc-13536.
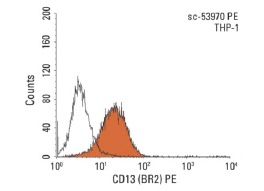
CD13 (BR2) PE: sc-53970 PE. FCM analysis of THP-1 cells. Black line histogram represents the isotype control, normal mouse IgG
1: sc-2866.