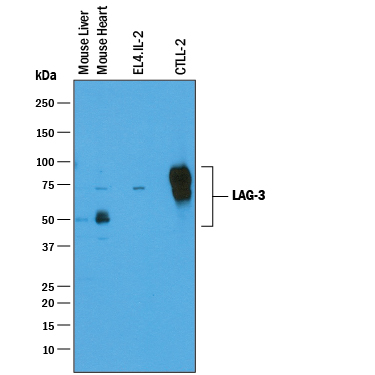
Western blot shows lysates of mouse liver tissue, mouse heart tissue, EL4.IL‑2 mouse lymphoblast cell line, and CTLL‑2 mouse cytotoxic T cell line. PVDF membrane was probed with 0.25 µg/mL of Goat Anti-Mouse LAG‑3 Antigen Affinity-purified Polyclonal Antibody (Catalog # AF3328) followed by HRP-conjugated Anti-Goat IgG Secondary Antibody (Catalog # HAF019). Specific bands were detected for LAG‑3 at approximately 54 kDa and 75 kDa in mouse liver and mouse heart tissue and 70-80 kDa in EL4.IL-2 and CTLL-2 cell lines (as indicated). This experiment was conducted under reducing conditions and using Immunoblot Buffer Group 1.