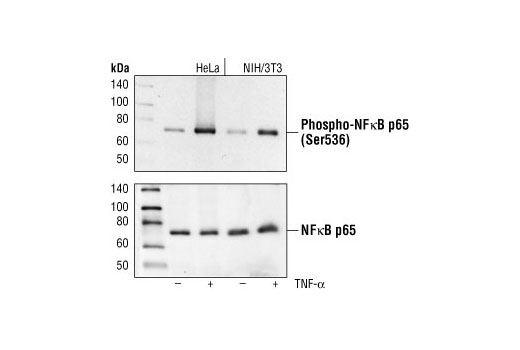
Western blot analysis of extracts from HeLa and NIH/3T3 cells, untreated or TNF-α treated (#2169, 20 ng/ml for 5 minutes), using Phospho-NF-κB p65 (Ser536) (93H1) Rabbit mAb (upper) or NF-κB p65 Antibody #3034 (lower).

Western blot analysis of extracts from THP-1 cells, differentiated with TPA (#9905, 80 nM for 24h) and treated with 1 μg/ml LPS for the indicated times, using Phospho-NF-κB p65 (Ser536) (93H1) Rabbit mAb (upper) and NF-κB p65 (C22B4) Rabbit mAb #4764 (lower).

Confocal immunofluorescent analysis of HeLa cells, serum starved (left) or TNF-α treated (#8902 at 20 ng/ml for 20 min, right), using Phospho-NF-κB p65 (Ser536) (93H1) Rabbit mAb (green). Actin filaments have been labeled with Alexa Fluor® phalloidin 555 (red).

Flow cytometric analysis of HeLa cells, untreated (blue) or TNF-α-treated (green), using Phospho-NF-κB p65 (Ser536) (93H1) Rabbit mAb compared to a nonspecific negative control antibody (red).