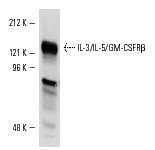
IL-3/IL-5/GM-CSFRβ (1C1): sc-21765. Western blot analysis of IL-3/IL-5/GM-CSFRβ expression in CHO cells transfected with GM-CSFR whole cell lysate.
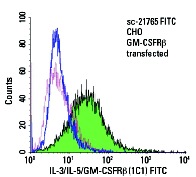
IL-3/IL-5/GM-CSFRβ (1C1) FITC: sc-21765 FITC. Solid green histogram represents CHO cells transfected with GM-CSFRβ. Dotted pink histogram represents non-transfected CHO cells. Blue line histogram represents control mouse IgG
1.
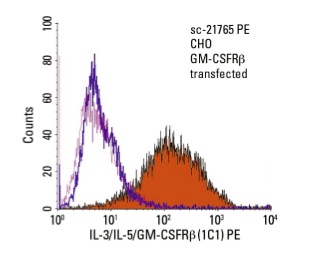
IL-3/IL-5/GM-CSFRβ (1C1) PE: sc-21765 PE. FCM analysis of control (dotted pink histogram) and GM-CSFRβ transfected (solid orange histogram) CHO cells. Blue line histogram represents the isotype control, normal mouse IgG
1: sc-2866.
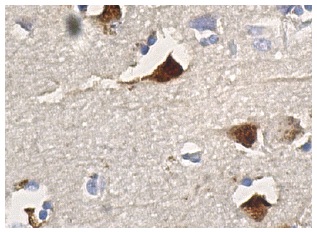
IL-3/IL-5/GM-CSFRβ (1C1): sc-21765. Immunoperoxi-dase staining of formalin fixed, paraffin-embedded human brain tissue showing cytoplasmic staining of neuronal cells.