H2A.Z polyclonal antibody - Premium (sample size)
| Name | H2A.Z polyclonal antibody - Premium (sample size) |
|---|---|
| Supplier | Diagenode |
| Catalog | C15410201-10 |
| Prices | $80.00 |
| Sizes | 10 µg |
| Host | Rabbit |
| Clonality | Polyclonal |
| Applications | ChIPseq ChIP-PCR WB ELISA ICC/IF |
| Species Reactivities | Human |
| Purity/Format | Affinity purified |
| Description | Rabbit Polyclonal |
| Gene | H2AFZ |
| Supplier Page | Shop |
Product images
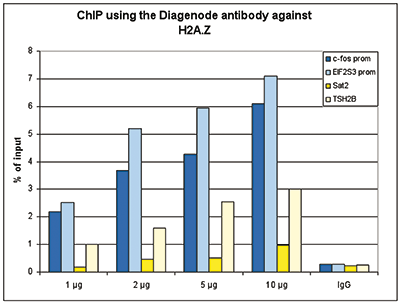 Figure 1. ChIP results obtained with the Diagenode antibody directed against H2A.Z
Figure 1A ChIP assays were performed using human HeLa cells, the Diagenode antibody against H2A.Z (cat. No. C15410201) and optimized PCR primer pairs for qPCR. ChIP was performed with the ““Auto Histone ChIP-seq” kit (cat. No. AB-Auto02-A100) on the IP-Star automated system, using sheared chromatin from 1,000,000 cells. A titration consisting of 1, 2, 5 and 10 μg of antibody per ChIP experiment was analyzed. IgG (2 μg/IP) was used as a negative IP control. Quantitative PCR was performed with primers specific for the promoter of the active genes c-fos and EIF2S3, used as positive controls, and for the inactive TSH2B gene and the Sat2 satellite repeat, used as negative controls. Figure 1B ChIP assays were performed using human K562 cells, the Diagenode antibody against H2A.Z (cat. No. C15410201) and optimized PCR primer sets for qPCR. ChIP was performed with the “iDeal ChIP- seq” ki
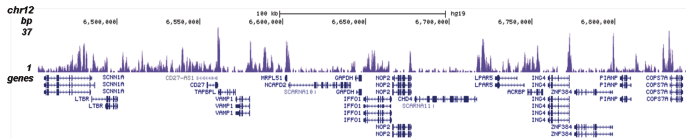
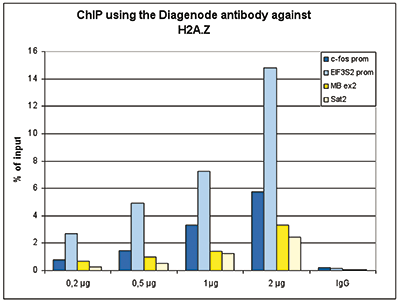 Figure 2. ChIP-seq results obtained with the Diagenode antibody directed against H2A.Z
ChIP was performed on sheared chromatin from 100,000 K562 cells using 0.5 μg of the Diagenode antibody against H2A.Z (cat. No. C15410201) with the “iDeal ChIP-seq” kit (cat. No. AB-001-0024) as described above. The IP’d DNA was subsequently analysed with an Illumina Genome Analyzer. Library preparation, cluster generation and sequencing were performed according to the manufacturer’s instructions. The 36 bp tags were aligned to the human genome (hg19) using the ELAND algorithm. Figure 2 shows the peak distribution in four genomic regions including the regions surrounding the EIF2S3 and c-fos positive control genes on chromosome X and 14, respectively (figure 2A and B).
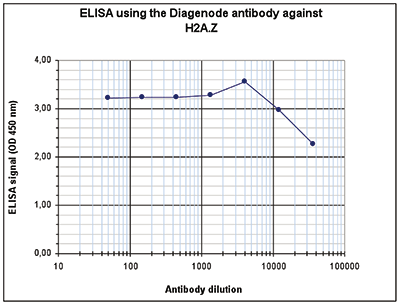
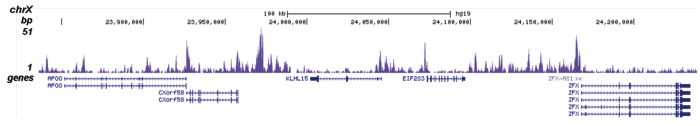 Figure 3. Determination of the antibody titer
To determine the titer of the antibody, an ELISA was performed using a serial dilution of the Diagenode antibody against H2A.Z (cat. No. C15410201). The antigen used was a peptide containing the histone modification of interest. By plotting the absorbance against the antibody dilution (Figure 3), the titer of the antibody was estimated to be 1:87,500.
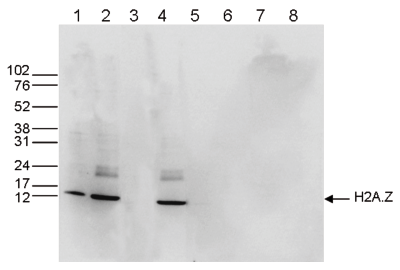
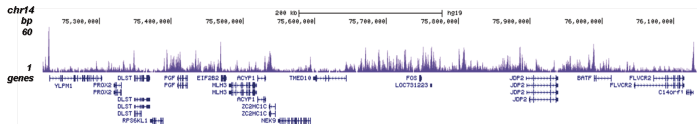 Figure 4. Western blot analysis using the Diagenode antibody directed against H2A.Z
Western blot was performed on whole cell (25 μg, lane 1) and histone extracts (15 μg, lane 2) from HeLa cells, and on 1 μg of recombinant histone H2A, H2B, H3 and H4 (lane 5, 6, 7 and 8, respectively) using the Diagenode antibody against H2A.Z (cat. No. C15410201). The antibody was diluted 1:1,000 in TBS-Tween containing 5% skimmed milk. Alternatively, Western blot was performed on histone extracts after incubation of the antibody with 1 μg of the peptide used for immunisation of the rabbit (1 hour at room temperature) (lane 3) or with a peptide containing a sequence from the central part of the H2A.Z protein (lane 4). The position of the protein of interest is indicated on the right, the marker (in kDa) is shown on the left.
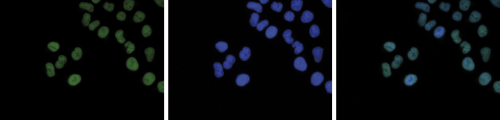
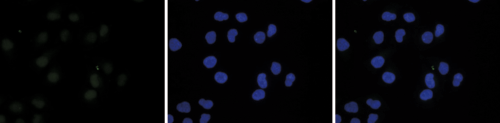
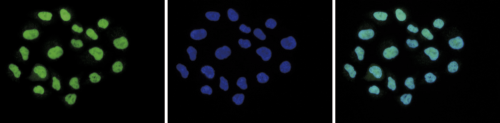
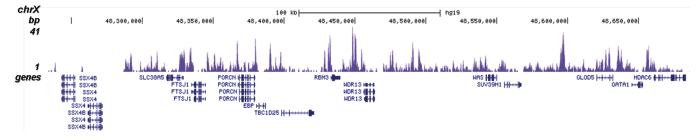 Figure 5. Immunofluorescence using the Diagenode antibody directed against H2A.Z
HeLa cells were stained with the Diagenode antibody against H2A.Z (cat. No. C15410201) and with DAPI. Cells were fixed with 4% formaldehyde for 10’ and blocked with PBS/TX-100 containing 5% normal goat serum and 1% BSA. Figure 5A: cells were immunofluorescently labeled with the H2A.Z antibody (left) diluted 1:500 in blocking solution followed by an anti-rabbit antibody conjugated to Alexa488. The middle panel shows staining of the nuclei with DAPI. A merge of the two stainings is shown on the right. Figure 5B and C: staining of the cells with the H2A.Z antibody after incubation of the antibody with 10 ng/μl of the peptide used for immunisation of the rabbit (figure 5B) and with a peptide containing a sequence from the central part of the H2A.Z protein (figure 5C).