 Figure 1. ChIP results obtained with the Diagenode monoclonal antibody directed against hGR
 ChIP assays were performed using HeLa cells, the Diagenode monoclonal antibody directed against GR (Cat. No. MAb-010-050) and optimized PCR primer sets for qPCR. The cells were treated either with ethanol (EtOH, used as a negative control) or triamcinolone acetonide (TA) for 4 hours prior to cell harvesting. ChIP was performed using sheared chromatin from 3 million cells and 5 μg of antibody. QPCR was performed with primers for the human metallothionein promoter (hMTIIA) and for exon 2 of the human myoglobin gene (hmyo ex2), used as a negative control. Figure 1 shows the recovery (the relative amount of immunoprecipitated DNA compared to input DNA) and the occupancy (ratio +/- control target). These results demonstrate the occupancy of the human metallothionein IIA promoter by GR.
 Figure 2. ChIP-seq results obtained with the Diagenode monoclonal antibody directed against hGR
 ChIP was performed on sheared chromatin from 3.5 million HeLaB2 cells using the Diagenode monoclonal antibody against hGR (Cat. No. MAb-010-050). The cells were treated with the synthetic GR ligand triamcinolone acetonide (TA) for 4 hours prior to harvesting. The IP’d DNA was subsequently analysed on an Illumina Genome Analyzer. Library preparation, cluster generation and sequencing were performed according to the manufacturer’s instructions. The 36 bp tags were aligned to the human genome using the ELAND algorithm. Figure 2 shows the peak distribution along the complete sequence of chromosome 16 (figure 2A) as well as the MT2A positive control gene (figure 2B). The position of the PCR amplicon is also indicated. Figure 2C, D and E show the results for the known GR target genes PER1 on chromosome 17 and FKBP5 and TNFAIP3 on chromosome 6.
 Figure 3. Sandwich ELISA
 The specificity of the Diagenode monoclonal antibody directed against hGR (Cat. No. MAb-010-050) was assessed by sandwich ELISA. Figure 3A: schematic representation of the sandwich ELISA with the monoclonal antibody against hGR (clone #:m2F8). Figure 3B: ELISA results using the monoclonal antibody against hGR at a concentration of 0.5 μg/ml. The figure shows an ELISA signal which is proportionally increasing with increasing amounts of recombinant hGR.
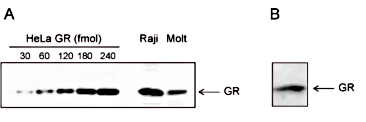
 Figure 4. Western blot analysis using the Diagenode monoclonal antibody against hGR
 Figure 4A. Extracts from HeLa cells containing the indicated amounts of GR (from 30 to 240 fmol), and from 5x10e6 Raji or Molt cells were analysed by Western blot using the Diagenode monoclonal antibody against hGR (Cat. No. MAb-010-050). Figure 4B. Western blot analysis of extracts from 300,000 HeLa cells with the Diagenode monoclonal antibody against hGR (concentration 1 μg/ml).
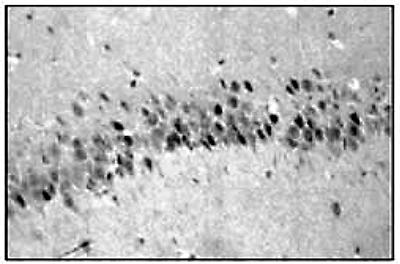
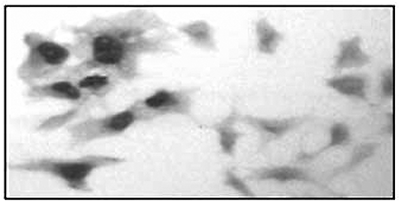
 Figure 5. Immunohistochemistry and immunofluorescence using the Diagenode monoclonal antibody against hGR
 1. Immunoreactivity of the Diagenode monoclonal antibody against hGR (Cat. No. MAb-010-050) in rat CA1 neurons of hippocampus. The antibody was used at a concentration of 2.5 μg/ml.
2. COS-7 cells transiently overexpressing human GR were labeled with the antibody against hGR followed by a biotinylated secondary antibody and peroxidase-labeled avidin. The antibody was used at a concentration of 2.5 μg/ml.
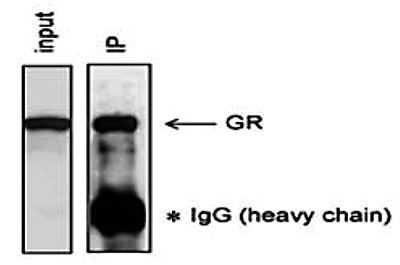
 Figure 6. Immunoprecipitation using the Diagenode monoclonal antibody against hGR
 The glucocorticoid receptor was immunoprecipitated from HeLa cell extracts (5 million HeLa cells in 100 μl IP reaction solution) using 5 μg of the Diagenode monoclonal antibody directed against hGR (Cat. No. MAb-010-050). The IP was followed by Western blot analysis as described above


