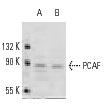
PCAF (H-369): sc-8999. Western blot analysis of PCAF expression in K-562 (A) and BJAB (B) whole cell lysates.

ChIP analysis of recruitment of CBP, p300, PCA and BRG1 to the IL-2α (CD25) promoter
in vivo. Antibodies tested include CBP (A-22): sc-369, p300 (N-15): sc-584, PCAF (H-369): sc-8999, and Brg-1 (H-88): sc-10768. CD3ε and Oct-2 promoter regions were employed as positive and negative controls, respectively. DNA was isolated from Rag
-/- thymocytes or Rag
-/- thymocytes expressing TCRβ. Data kindly provided by J. Imbert and reproduced from Yeh, J-H.,
et al., Nucleic Acids Research, 2002, 30: 1944-1951, with permission from Oxford University Press.

PCAF (H-369): sc-8999. Western blot analysis of His-tagged human recombinant PCAF.

ChIP analysis of cofactor occupancy dynamics on the
IL-
8 promoter in 293 cells in response to IL-1β treatment. Antibodies tested include NCoA-3 (F-2): sc-5305, NCoA-3 (M-397): sc-9119, NCoA-3 (N-17): sc-7217, NCoA-3 (C-20): sc-7216, SRC-1 (M-341): sc-8995, SRC-1 (C-20): sc-6096, SRC-1 (M-20): sc-6098, GRIP1 (M-343): sc-8996, PCAF (C-16): sc-6300 and PCAF (H-369): sc-8999. Data kindly provided by M.G. Rosenfeld and reproduced with permission from Baek
et al., Cell 2002, 110: 55-67.