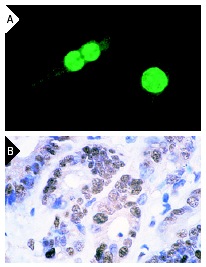
PCNA (PC10): sc-56. Immunofluorescence staining of methanol-fixed NIH/3T3 cells (A). Immunoperoxidase staining of formalin-fixed, paraffin-embedded human liver tumor showing strong nuclear staining of hepatocytes (B).
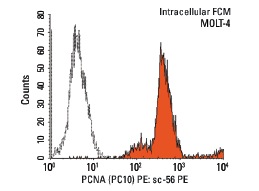
PCNA (PC10) PE: sc-56 PE. Intracellular FCM analysis of fixed and permeabilized MOLT-4 cells. Black line histogram represents the isotype control, normal mouse IgG
2a: sc-2867.
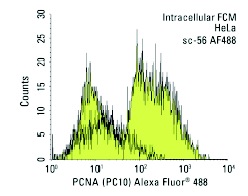
PCNA (PC10) Alexa Fluor 488: sc-56 AF488. Intracellular FCM analysis of fixed and permeabilized HeLa cells. Black line histogram represents the isotype control, normal mouse IgG
2a: sc-3891.
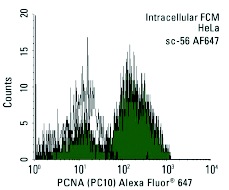
PCNA (PC10) Alexa Fluor 647: sc-56 AF647. Intracellular FCM analysis of fixed and permeabilized HeLa cells. Black line histogram represents the isotype control, normal mouse IgG
2a: sc-24637.
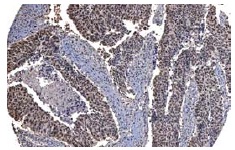
PCNA (PC10): sc-56 Immunoperoxidase staining of formalin fixed, paraffin-embedded human urothelial cancer showing nuclear staining of tumor cells. Kindly provided by The Swedish Human Protein Atlas (HPA) program.
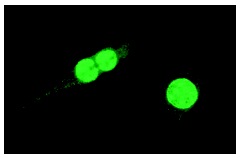
PCNA (PC10): sc-56. Immunofluorescence staining of methanol-fixed NIH/3T3 cells.
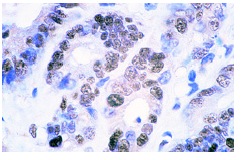
PCNA (PC10): sc-56. Immunoperoxidase staining of formalin-fixed, paraffin-embedded human liver tumor showing strong nuclear staining of hepatocytes.
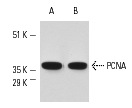
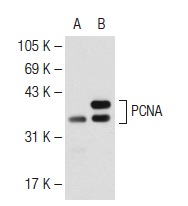
PCNA (PC10): sc-56. Western blot analysis of PCNA expression in A-431 (A) and NIH/3T3 (B) whole cell lysates.
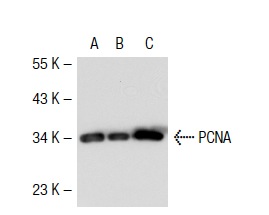
PCNA (PC10): sc-56. Western blot analysis of PCNA expression in non-transfected 293T: sc-117752 (A), mouse PCNA transfected 293T: sc-127307 (B) and A-431 (C) whole cell lysates.
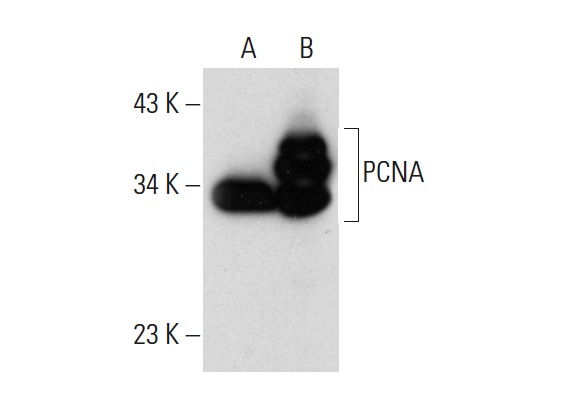
PCNA (PC10): sc-56. Western blot analysis of PCNA expression in non-transfected: sc-117752 (A) and human PCNA transfected: sc-159920 (B) 293T whole cell lysates.
PCNA (PC10): sc-56. Western blot analysis of PCNA expression in non-transfected: sc-117752 (A) and human PCNA transfected: sc-170834 (B) 293T whole cell lysates.
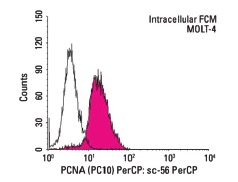
PCNA (PC10) PerCP: sc-56 PerCP. Intracellular FCM analysis of fixed and permeabilized MOLT-4 cells. Black line histogram represents the isotype control, normal mouse IgG
2a: sc-45112.
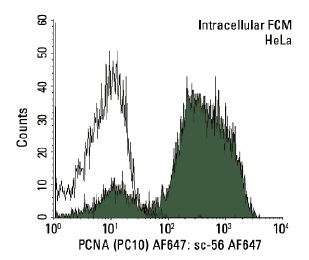
PCNA (PC10) AF647: sc-56 AF647. Intracellular FCM analysis of fixed and permeabilized HeLa cells. Black line histogram represents the isotype control, normal mouse IgG
2a: sc-24637.
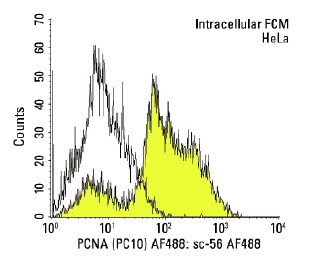
PCNA (PC10) AF488: sc-56 AF488. Intracellular FCM analysis of fixed and permeabilized HeLa cells. Black line histogram represents the isotype control, normal mouse IgG
2a: sc-3891.
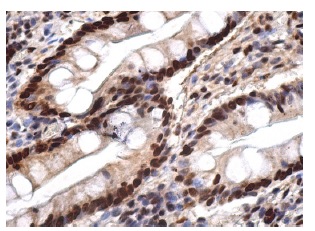
PCNA (PC10): sc-56. Immunoperoxidase staining of formalin fixed, paraffin-embedded human small intestine tissue showing nuclear staining of glandular cells.